| TIME FOR AN UPDATE!! |
|
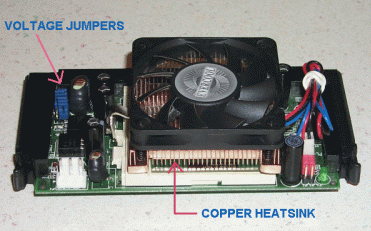
Since I wrote my original review of the Powerleap iP3/T adapter late last November 2001, much has happened. In addition to the 1.2GHz Tualatin Celeron processor used in the original product release, a 1.3GHz version has been available for awhile and the new 1.4GHz Celeron version just went on sale this week. Also, a "rev.2" version of the adapter was introduced by PowerLeap in May, incorporating an improved heatsink/fan and core voltage adjustment jumpers. A photo of the new unit is shown at right.
So it seemed like an "addendum" to my original review was in order, comparing the performance of the three different Tualatin Celerons in the iP3/T, as well as the "baseline" Coppermine P3-850MHz and P3-1GHz processors. Though commercial supplies of the former seemed to have dried up now, the P3-1GHz CPU is still offered for sale on several websites. Best price I have seen on the latter is $179 at Googlegear.
Also thrown in is a little overclocking information for the new 1.4GHz iP3/T rig. I had previously published data on overclocking the 1.3GHz processor, available HERE.
| BENCHMARKING SCHEME |
For purposes of benchmarking, I used the following tests. Note that I have dropped the Sisoft Sandra CPU benchmarks from my battery of tests because I've come to the conclusion that they are essentially worthless as a measure of actual performance. They appear to give nothing but a mathematical comparison of clockspeed, yielding no more information than you would get by computing clockspeed ratios on a calculator!
For the tests used, I have intentionally adjusted conditions to try to make them as highly CPU dependent as is practical. Thus, for example, you will see that most of the video-related tests are done at low resolution and color depth to insure that the video card is under very low stress and the CPU is bearing the brunt of the load. The exception was 3DMark2001 SE, where the default condition of 1024x768x32 was employed, to enable comparison to other reported results for this widely-quoted benchmark. The tests used were:

- PCMark2002 CPU Benchmark (default test)
- 3DMark2001 SE DirectX Video Benchmark (default test)
- GL Excess v.1.1 OpenGL Video Benchmark (640x480x16, all tests)
- Quake 3 Arena "Demo002" Timedemo (640x480x16)
For all tests, vsync was disabled and antialiasing was turned off.
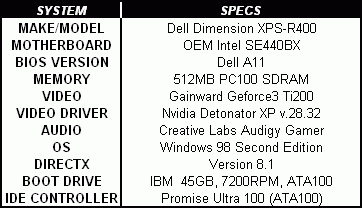
The main testing was done on my Dell Dimension XPS-R, configured as shown at right.
And what, pray tell, were the results? Glad you asked....

