| SISOFT SANDRA 2001 CPU / MULTIMEDIA BENCHMARKS: |
As expected, these results mirrored the relative differences in clockspeed between the three upgrade processors almost exactly, and gave the greatest spread (about 43%, overall). But, as mentioned previously, these results can be very misleading taken on their own, because they reflect the CPU clockspeed and very little else. Other subsystems in the PC are largely ignored by this benchmark, and are often bigger performance bottlenecks than the CPU speed. The two different platforms were very comparable on this test, with the Dell slightly faster (~4%). Note that the different video cards in the two Dell system configurations have essentially no impact on the results, because it is a "pure" CPU test. Also note the poor showing of the P2-400 on the Dell/Geforce3 system, especially for the floating point SSE test, reflecting the limitations of the older Pentium II "Deschutes" processors.
| SiSoft Sandra Benchmark Results |
| |
| Dell XPS-R/Voodoo5 |
AOpen AX6BC/Geforce2 GTS |
Dell XPS-R/Geforce3 Ti200 |
Click on chart to enlarge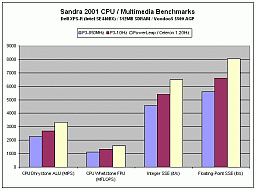 | |
Click on chart to enlarge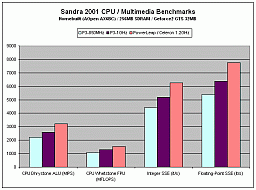 | |
Click on chart to enlarge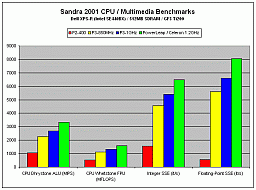 | |
| SYNTHETIC VIDEO BENCHMARKS: |
3DMark 2000/2001 - The results on these two popular DirectX video benchmarks were very comparable, and much tighter overall than the Sandra results, with a spread of about half as much. This makes sense, because now other PC subsystems come into play. The good news here was that the PowerLeap rig maintained it's relative performance advantage over the P3's. Where the Coppermine Celerons would start to show their inherent limitations vs. the P3 architecture, the Tualatin Celeron shows no such innate performance penalty. Also, the three PC configurations are much more differentiated here, reflecting the broad range of 3D rendering capabilities of the different video cards used. And though not as dramatic as seen in the Sandra results, the inferiority of the P2-400 versus any of the three upgrade processors is very clear, with a relative performance penalty of 54 to 124%, depending on the test and CPU compared.
GL Excess - This OpenGL video benchmark continues the trends shown in the 3DMark tests. The data spread becomes even tighter, indicating an even greater effect of non-CPU system bottlenecks. But, again, the relative lead of the PowerLeap/Celeron 1.2GHz combo over the P3's is retained. The effect of the particular video card used is again very evident in the results.
Here are the charts of the results for these three synthetic video benchmarks:
| Synthetic 3D Video Benchmark Results |
| |
| Dell XPS-R/Voodoo5 |
AOpen AX6BC/Geforce2 GTS |
Dell XPS-R/Geforce3 Ti200 |
Click on chart to enlarge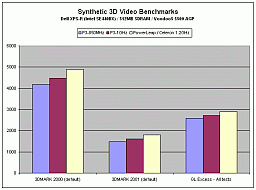 | |
Click on chart to enlarge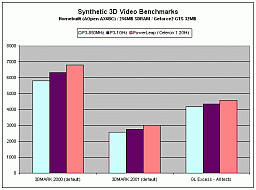 | |
Click on chart to enlarge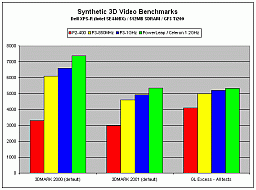 | |
Quake 3 Arena - This popular OpenGL game substantiates the trends demonstrated in the synthetic video benchmarks. The spread between the three upgrade CPU's remains fairly tight (9 - 17%), but the PowerLeap rig continues to maintain its lead. And the relative video card performance trends continue, unsurprisingly.
Unreal Tournament - Here we see an even tighter spread between the CPU's, but the relative performance spacing remains the same. This one is interesting, because the three systems run this game with different graphics API's--DirectX for the two Geforce cards, and Glide for the Voodoo5. Since UT was originally developed to run on the 3dfx Glide API, the Dell/V5 system actually edges out the Geforce cards in this single case. But with 3dfx dead, I don't expect that anybody is coding new games for Glide!
Serious Sam - The last of the three game benchmarks completes a consistent picture, with the performance range edging back up to about 20%, and the PowerLeap rig maintaining its relative lead over the P3's.
Looking at the relative results of the original P2-400 processor vs. the three upgrade processors on the Dell/Geforce3 system shows the gaming performance handicap imposed by using an old, slow CPU, even when a high-end video card is present. The three faster processors increase game frame rates by large margins, more than double in several cases. And if you happen to be running an old P2 processor with an "original equipment" video card like the Velocity 128 or TNT, then the prospects of being able to run any of the newer 3D games with anything approaching acceptable frame rates becomes pretty much hopeless!
Here are the game benchmark charts:
| 3D Game Benchmark Results |
| |
| Dell XPS-R/Voodoo5 |
AOpen AX6BC/Geforce2 GTS |
Dell XPS-R/Geforce3 Ti200 |
Click on chart to enlarge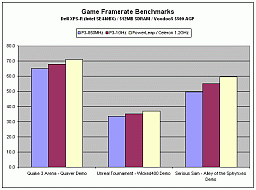 | |
Click on chart to enlarge | |
Click on chart to enlarge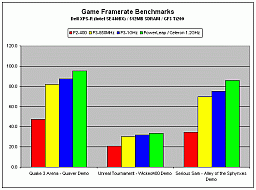 | |
So what does all of this mean??


